Sunday, September 22, 2013

Anatomy of a Large Leak in Encore and SleepyHead

An oldie, but a goodie from one of my posts on cpaptalk.com.

It's commonly assumed that machines "chase" large leaks by increasing pressure (if allowed) or keeping the pressure at the max (if you are already maxed out).   That was apparently true of the older generations Auto machines.   But the System One Auto algorithm will decrease the pressure when it detects a  Large Leak in an attempt to help reseal the mask.   (More about this later.)

Large Leaks in Encore.


Those of us using System Ones know all about how vague the whole issue of Large Leaks in Encore is.   There's no numerical definition that is the equivalent of the RedLine in ResScan.   Some people battle Large Leaks a lot of the time.   Others hardly ever see an official Large Leak---even when they are leaking significantly.   And the relationship between the expected leak rate for a given mask at a given pressure and the trigger for flagging something as a Large Leak also is murky and undocumented in the clinical and user manuals for our machines.

I've been using a PR System One BiPAP Auto now since 12/22/2010.   That's 33 months.   And in all that time, I've had exactly two Large Leaks flagged by Encore.   I've had plenty of other (isolated) problems associated with leaking:  The occasional dry mouth (or even wore, the mouth the tastes like something crawled in and died in it).   The larger than normal bumps on the leak graph during particularly bad allergy nights or nights with serious congestion from the flu or a head cold.    And numerous so-called "patient disconnects" where the machine mysteriously "loses" track of my breathing pattern, and the wave form peters out with smaller and smaller bumps until there's a gap in the wave form, but not the leak and pressure graphs.  The "patient disconnects" also are earmarked by long series of PPs---I guess the machine is trying to use the PPs to sort out the breathing pattern.  Many of these occasional leak problems occur when my total leak rate is around 20-25 L/min above my expected leak rate---in other words, these occasional problems occur when my leak rate would likely lie near or above the RedLine in ResScan.  But as I've said, Encore has only flagged one Large Leak in the 21 months I've used the machine.

My first official Large Leak has a number of features in it that may be useful to look at as a way of helping others understand just what can go on during an official Large Leak as well as illustrate why leaks that are large, but not large enough to be officially flagged as Large Leaks may also be problematic---both in terms of quality of therapy and in terms of accuracy of the data.

Here's the full night's data as shown in Encore:

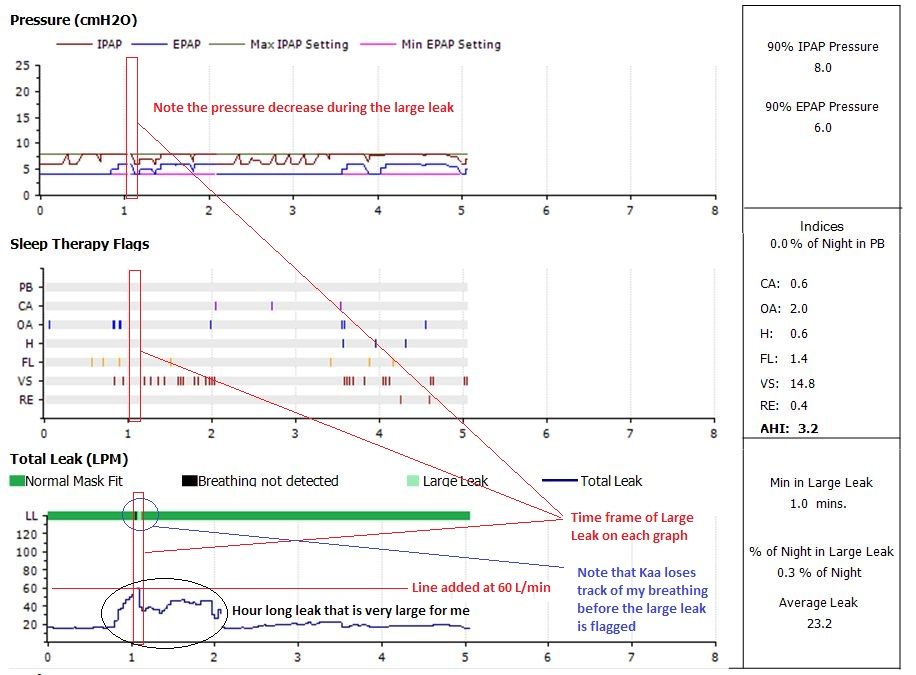
The one minute long Large Leak, of course, is flagged by the light green bar in the leak graph.   One thing that I want to point out is that during the Large Leak, my machine (Kaa) decreases the pressure rather than increases it.  It's commonly assumed that machines "chase" large leaks by increasing pressure (if allowed) or keeping the pressure at the max (if you are already maxed out).   That was apparently true of the older generations Auto machines.   But the System One Auto algorithm will decrease the pressure when it detects a  Large Leak in an attempt to help reseal the mask.   (More about this later.)

I's also worth pointing out the ugly Black bar in the leak graph that immediately precedes the light green "Large Leak" indicator.    Black bars like this in Encore leak lines mean that the machine was ON, but it could not detect a meaningful breathing pattern.  If you take the mask off and leave the machine running, you'll get one of these big ugly Black Bars.   But in the presence of Large Leaks, the machine can have trouble detecting the breathing pattern and ear mark the period in Encore with an ugly Black Bar.   Also note the small breaks in the pressure line and the leak graph that correspond to that Black Bar of "no breathing detected".   As we'll see in a minute, that seems to be an artifact of Encore.


The same Large Leak in SleepyHead


Here's the same night's data viewed in SleepyHead:


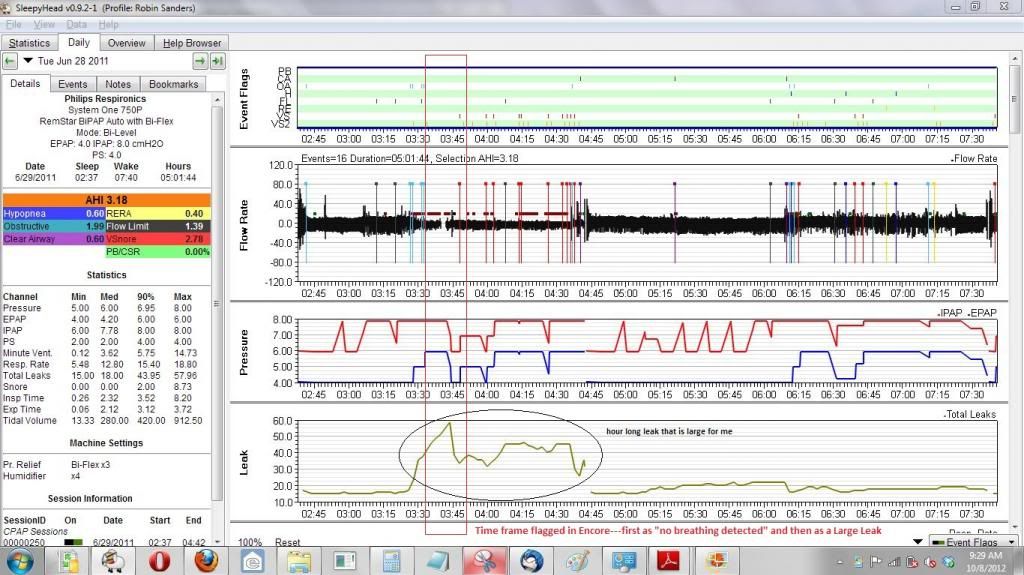
Note that SleepyHead has no way of flagging an "official Large Leak" in the data.   In looking at lots of data from forum members on cpaptalk.com, it seems safe to say that Encore's Large Leak flags depend on both the pressure and on whether the System One is a Series 50 or a Series 60 machine.

In SleepyHead, we see a break in the wave form (where the Black Bar over the leak graph is in Encore) preceding the biggest bump on the Leak graph.  For those who track such things---SleepyHead says that the maximum leak rate topped out at 57.96 L/min, which is about three times my usual, expected leak rate of 18-20 L/min (based on many many nights of SleepyHead data) and about twice my mask's published expect leak rate of 29 L/min at my maximum pressure of 8cm.   (Note, however, that my leak rates seem to follow the leak rate numbers of my EPAP, which ranges from 4 to 6 rather than my IPAP.)

Also of note are all those little Pressure Pulse (PP) boxes sprinkled throughout the hour-long leak that is both abnormally long and abnormally large for me.  More on these clusters of PPs in a bit.


 What actually happens during the Large Leak?


Let's zoom in on the period right around where Encore puts the big Black Bar and the Large Leak is flagged.  This is what we see in SleepyHead when we focus right our attention on the Large Leak itself:

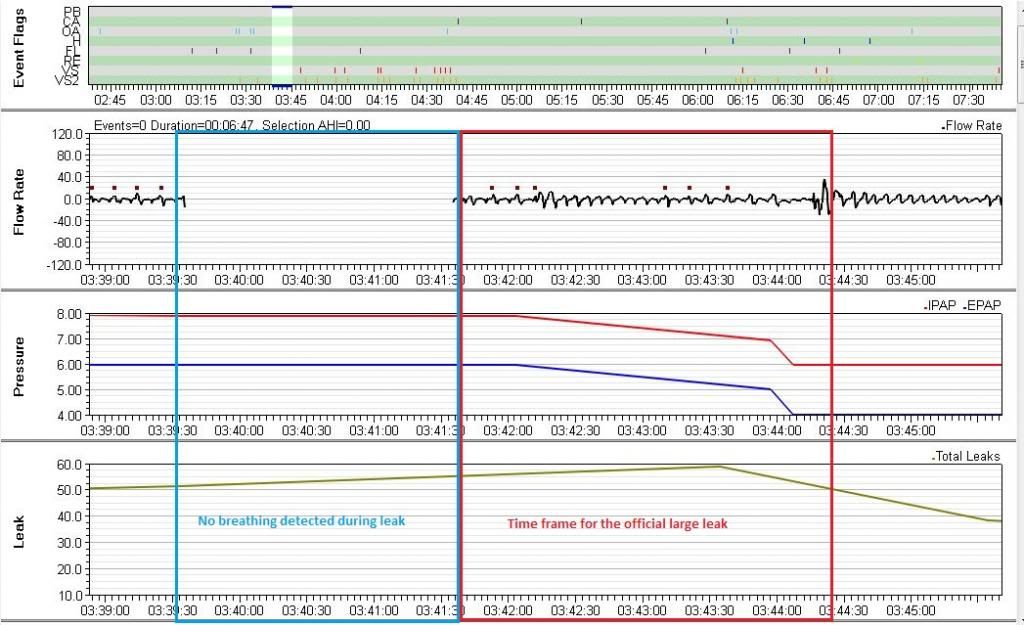
This close up shows that Sleepy Head definitely has no break in the pressure and leak graphs at the Large Leak, the way the Encore graphs did.

Now note how the wave form is severely compressed near the 0 line just before and just after the gap in the wave flow.  This indicates that Kaa could not reliably determine whether there was much air going into or out of my lungs.   Note how when the wave form picks up after the gap, it's still pathetic looking.   And also note that it has none of the characteristics of what my wave form usually like when I'm awake enough to turn Kaa off and back on.   So I'm fully asleep during this part of the leak.

And notice all those PPs right before the gap in the wave form and right after the wave form picks back up?   I believe those PPs are being used by Kaa to try to figure out if there's a live, breathing person at the other end of the hose.   I think Kaa realizes that these periods of very low variation in the wave flow are way too long to be a typical apnea or hypopnea, and that's why they are not flagged as such.   But it also gets so befuddled about what it's seeing in the wave form data, that Kaa concludes I must not be breathing through the mask and it drops the wave form recording all together during the time it cannot determine any meaningful breathing pattern--and the period of "no detectable breathing" is earmarked by the ugly Black Bar in Encore.  When I showed my DME this wave form pattern (in a different context), the RT referred to it as a "patient disconnect".  (And yes, that bothered me because "patient disconnect" seems to imply that I, the patient, disconnected the machine from my nose.   And I most certainly did NOT do that here or anywhere else where I've seen these patient disconnects.)  So from now on, I'll call those wave patterns "patient disconnects" even though I don't like that language at all.

A couple of minutes after Kaa detects the "patient disconnect" Kaa finds rudimentary evidence of breathing again, so it starts recording the wave form data.   But by this point the leak rate has also grown to about 55 L/min and Encore (and Kaa) decide to flag this as a Large Leak.   As in---there's breathing present and the leak is now large enough to meet that unknown standard of Large Leak.   And it's important to note that almost as soon as the Large Leak is detected, Kaa starts to lower my pressures:  First from 8/6 to 7/5 and then more sharply from 7/5 to 6/4.   Kaa is attempting to help limit or even fix that Large Leak by lowering the pressures---exactly as the description of the PR Auto algorithm says it is supposed to do in the presence of Large Leaks.

As far as accuracy of recording events during this Large Leak:   Because Kaa can barely detect a breathing pattern, it's clear that the usual definitions used to flag OAs, CAs, and Hs are going to be difficult to apply:  They all rely on a reasonably accurate baseline of the current airflow into/out of the lungs and that baseline is calculated using several minutes worth of data.   Because the breathing pattern is barely there, it's almost impossible for the machine to detect enough of a decrease in airflow to trigger flagging an OA or a CA or an H throughout the Large Leak (and even in the part of the longer, not-quite-so-large leaks immediately preceding and following the official Large Leak itself.   And hence there's no good reason to believe that this time frame is really as "event-free" as the event chart makes it appear to be.

Now I want to zoom out just a bit---to see the entire hour of leaking that was large by my data's usual numbers, but not large enough to be flagged as a Large Leak in Encore.   Here's a picture of the whole hour-long leak:


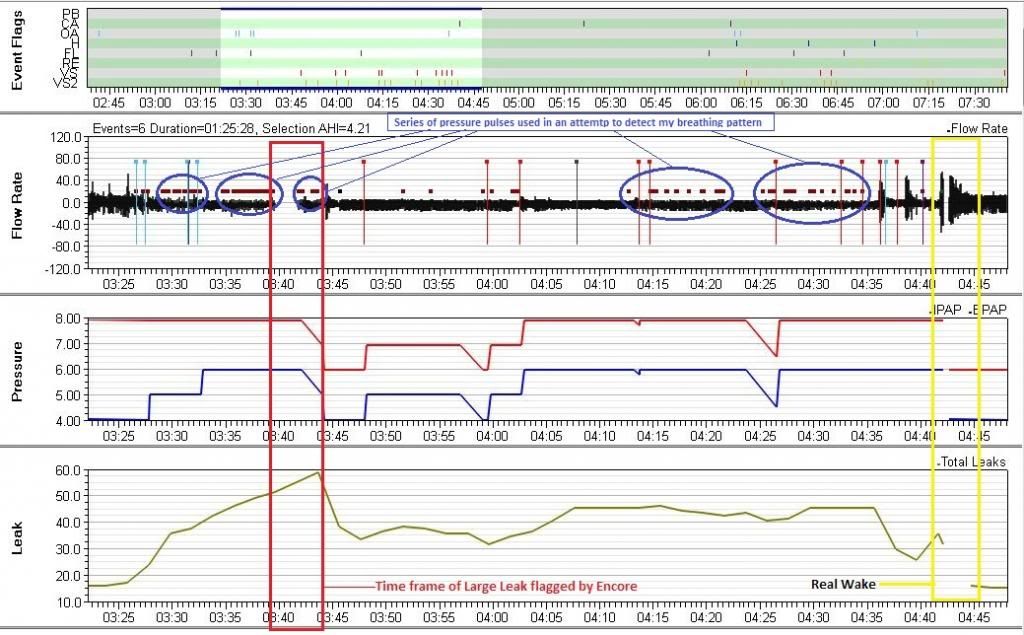
Those pesky PP boxes that pop up throughout this hour long period correlate closely to the periods of highest leak rates during this leaky hour---but most of those leaks are NOT large enough to be flagged by Encore as Large Leaks.   And when I zoom in on those clusters of PPs, the wave forms look almost as anemic and as squashed as the wave form during the close up of the large leak.   In other words, it's clear from the PPs and wave form that Kaa was having trouble tracking my breathing for much of this leaky hour---not just the part flagged as a Large Leak by Encore.   In other words, when the leak rate is flirting with Large Leak territory, the machine can have a tough time sorting out what's actually going on in the wave form.   And that clearly means that data during periods with "patient disconnects" and wave flow patterns associated with "patient disconnects" may not be very accurate:  You can't detect an apnea or hypopnea if you can't detect the breathing pattern in the first place.  

It's also clear at this level of magnification that the gap in the wave form during the Large Leak (the "patient disconnect") is distinctly different from the gap in the wave form where I wake up and turn the machine off and then back on.  


What might have caused this Large Leak? And how did it affect the quality of my sleep?


Well there's a pair of "double" OA's that occur right around 3:30---one pair occurs a bit before 3:30 and the other occurs a bit after.   Each pair of OA's causes my EPAP to increase by 1cm.   My IPAP was already running at 8cm due to some earlier flow limitations and the hunt-and-peck part of the PR Auto algorithm.  I seriously doubt the 2cm increase in EPAP lead to the leak.  It's not an uncommon event in my data and 8/6 is still relatively low pressure.   My guess is that about the time of that pressure increase I started mouth breathing.  Mouth breathing is a rare thing for me, but we were in NJ in late June 2012 on this night, and that's peak allergy season for me.   And there's a lot of snoring going on during that leak.   I usually snore with my mouth closed, but in allergy season? Open mouth snoring does occasionally happen to me.   But I could also have dislodged one of the nasal pillows somehow.   Or perhaps one of the pillows became inverted.   Or maybe it was a combination of all these things.

But what ever happened, the leak continued to grow until the machine lost track of my breathing and the leak was large enough to trigger a Large Leak flag.   I still didn't wake up (which rather amazes me), but once the machine lowered the pressure back down to 6/4, the peak of the large leak rate decreased.  Possibly my mouth partly closed.  Possibly the dislodged nasal pillow was partially able to reseat itself.   Whatever.   But leaking remained an issue---either I kept breathing through my mouth or that pesky pillow remained out of place.   And as the pressures fluctuated (mainly due to SNORING), so did the leak---never as far into Large Leak territory as the beginning of the leak, but high enough up where the machine was worried about whether it was tracking breathing or not.   And while the machine was able to detect SNORING, it certainly was not detecting anything that met its definitions of OAs or Hs, possibly because the wave flow itself was so difficult to detect at all when the leak as high as 45 L/min.

By 4:45 I'm clearly restless:  There's a possible snoring arousal followed by an OA (that may be due to transitioning back to sleep) followed by more snoring, another possible arousal and a CA (that may be transitional) and the real wake where I am conscious enough to turn Kaa off and back on and in the process fix whatever the problem that caused the leak was.   Certainly if it was mouth breathing, I didn't open my mouth again for the rest of the night.    Or perhaps it was that I did find and fix the dislodged nasal pillow at the wake.   My sleep log notes a couple of wakes and lots of aerophagia and a general lousy feeling in the morning after this night.  So this leak, together with the higher than normal AHI for the rest of the night as well did disturb my sleep.   

Fortunately, this kind of leaking is pretty rare for me.   This particular hour long leak is both larger and longer than even the worst of my "typical" leaks.   The worst of my leaks typically top out around 40 or 45 L/min and I don't have many of them that large.   My bad leaks are typically less than 30 minutes in length, with a few of them lasting as long as this one.   I typically see a 30-40 minute "bad" leak maybe two or three times a month at most.   But they often have multiple PPs in them without events being flagged and they occasionally have "patient disconnects" in them as well.   But note that I have also had "patient disconnects" where there was no leaking going on.  And because this kind of a large leak is such a rare occurrence in my data, I'm comfortable to writing it off as a visit from the aliens.   But if I were seeing this kind of leaking going on several times a week (instead of a few times a month), I'd be inclined to work on figuring out what was causing the problems.

Friday, August 9, 2013

Yes, this blog is still alive

Just a very quick note to let anybody who's found this blog through web search engines that yes, I'm still blogging.

In the last year I've not had any real time to devote to the blog.   I've got two drafts of posts to come, but they're not ready for prime time.

I do periodically go through the "important" pages or posts to make sure that the information posted is still correct or reasonably correct to the best of my knowledge. 

Friday, August 17, 2012

Looking at the same data in Encore and SleepyHead

I've been gathering detailed data about my PAP therapy, my insomnia, and the all important "how do I feel?" data since April 2010. I've been looking at my PAP data in both Encore and in SleepyHead. All my SleepyHead data is now in SH 0.9-2. And I thought it might be useful to folks if I showed how both software packages show the same set of data.

For this exercise, I've chosen the night of July 1, 2012. Note that bedtime was 2:52 AM on July 2. This was the night when I broke my left pinky when I was out on my nightly walk/jog, so pain was an issue: At the ER, all the doc did was pull the broken and dislocated finger straight, buddy taped it to the ring finger, took x-rays, and informed me that I needed to see a hand specialist the next day because the finger likely needed to be pinned. Because of the pain, I took a sonata that night. Undoubtedly those things adversely affected my sleep that night because this was a night where my snoring was much worse than it normally is and the AHI is a bit higher than it typically is.

Here's the night's data in Encore:

ev-data


And here's the same night in SH:

sh-data


AHI and the other indices

If you look at the index numbers, you'll see that the only difference between the AHI, OAI, CAI, HI, FLI, and REI numbers are that SH rounds to two decimals and Encore rounds to one decimal. If you round the SH numbers to one decimal, you get the Encore numbers.

But clearly that's not the case for the VSI numbers. Encore reports a VSI = 63.8 and SH's VSnore Index = 7.43. Of course, the SH VSnore index only includes VS1s. But even if we take the VS2s into account, it's still impossible to immediately reconcile the Encore VSI with SH data. Clicking on the events tab for this night reveals that SH says there were 48 VS1s and 57 VS2s recorded during the night. That's a total of 105 snores altogether. And if we compute a snore index in the usual way, we'd expect:
snore index = (105 snores)/(6.45833333 hours) = 16.258
Interestingly, our computed snore index is about 1/4 the size of Encore's VSI. But it's not clear at all how Encore is computing the VSI. Digging deeper into the snore data, I can show that on this particular night:
(Sum of the VS2 parentheses numbers)/(usage time) = Encore VSI
I have no idea if this is the real definition of the Encore VSI or just an interesting coincidence. And I don't want to get too side tracked by the snore data---that's another post I intend to write later.


Leak data

Notice that Encore reports the average total leak, but I've chosen "median" for the middle computations in SH. However, SH computes the "averages" for each of the items listed in the left sidebar even if you've set the default to "median". To see these "averages", all I have to do is hover my mouse over the name and the "average" will appear in a pop-up box.

On this night, the median leak rate just happens to be pretty close to the average leak rate. (That's a mathematical coincidence.) Sleepy Head computes the average leak rate as 18.03 L/min, which rounds to Encore's 18.0 L/min average leak rate. I find that usually the SH average leak rate and the Encore average leak rates are typically pretty close.

The leak line in Encore looks much flatter than the one shown in SH. That's because of the scale of the vertical axis in each graph: My leak data on this night is trapped in an 8 L/min range (from a low of 15 L/min to a high of 23 L/min). On the SH graph, the total range for the graph is from 10 L/min to 30 L/min. So the leak data fill up just over a third of the available space in the vertical direction. But the vertical range for the Encore graph is from 0 L/min to 140 L/min, and my data takes up only 1/16 of that range. Hence the bumps look much smaller in Encore than they do in SH. And for newbies: This night's leak line is a really nice leak line.


Pressure data

The 90% pressure data is problematic: Ever since I switched to SH 0.8.8, I've noticed that SH almost always gives me integer values for the 90% pressure data, but it reports it to two decimals. In other words, rounding the SH 90% pressure data to one decimal doesn't change it. The difference between Encore's 90% IPAP = 7.9 and SH's 90% IPAP = 8.00 doesn't seem big enough to worry about.

But Encore's 90% EPAP = 5.5 and SH's 90% EPAP = 6.0 differ by 0.5 cm and my max EPAP = 6cm, so that's a pretty large discrepancy. And for the 90% EPAP, large discrepancies between Encore and SH seem to be common in my data. So which software should I believe for the 90%b EPAP number?

It's worth pointing out that JediMark, the author of Sleepy Head, knows that there are some problems with how he is computing 90% and 95% numbers. But it's also useful to point out that Encore's 90% numbers do not always make sense eirther.

For this night's data I can get a rough idea of which is more likely the correct number by doing a bit of basic arithmetic: I used the machine for 6:27:31, which is close enough to 6:30 for approximations. And 10% of one hour is 6 minutes. So 10% of 6.5 hours is 6*6.5 = 39 minutes. So the question becomes: Can we find about 40 minutes or so of time with the EPAP pressure at around 6 cm? If so, then the 90% EPAP = 6. And in eyeballing the pressure curve, it's clear the EPAP = 6 for at least 30 minutes between 3:00 and 4:30 and it's also clear that the EPAP = 6 for at least 30 minutes between 7:00 and 8:00. Hence, it's clear that EPAP = 6 for at least an hour, which indicates that the 90% EPAP really should be reported as 6cm instead of 5.5cm.

Thursday, August 2, 2012

Data available on the ResMed S9's LCD

The ResMed S9 AutoSet and S9 Elite have a wealth of efficacy data available right on the machine's LCD. The available on-screen data runs rings around the woefully inadequate data provided by the PR System One's LCD. (Note that if you are willing to download the System One data into Sleepy Head or Encore, all the bells and whistles of full efficacy data are there. It's just the System One's on-board data that sucks.)

But many newbie users of the Resmed S9 are not shown how to access the LCD's efficacy data by the DME that sets up their machine.

So---if you are using a Resmed S9 Elite or a resmed S9 AutoSet and you want to know how to get to the LCD's efficacy data and what that efficacy data tells you about the quality of your therapy, this post should answer your questions.

Step-by-step instructions on how to get to the Sleep Quality Report on your S9's LCD

  1. Press the info button on the S9 to get into the Short Sleep Quality Report. You should see your Usage for the night, an icon indicating Mask Fit for the night, and the AHI for the night. Note that Mr. Red Frowny Face shows up if your excess leak rate is AT or ABOVE 24 L/min for at least 30% of the night. If you only see the Usage data, your DME has locked you out of the full Sleep Report Data. Take the machine back to theDME and demand that they change the setting for Sleep Quality from Usage to On. Or learn how to get into the clinical menu and set Sleep Quality to On yourself.
  2. If you want more detailed information, you can go from the short Sleep Quality Report to the more detailed Long Sleep Quality Report by holding both the info and the double check buttons down at the same time for three seconds or so. You may notice a brief flash.
  3.  Use the large round knob to scroll down ONE icon on the left hand list of icons. You should now see the top of the detailed Sleep Quality menu. And then CLICK the round button to select the detailed Sleep Quality menu. This will now let you scroll all the way through the detailed Sleep Quality menu to see the AHI, AI, and CAI, which are at the bottom of this menu. It will also allow you to change the data period from 1 Day to 1 Week to 1 Month to 3 Months to get an idea of the averages of the data over longer time frames than over night.


Information on what data is available on the S9's LCD in the Long Sleep Quality Report


The S9's software detects four types of respiratory events: Obstructive apneas, central apneas, unknown apneas, and hypopneas. The unknown apneas are events that the S9's algorithm detects as apneas, but cannot tell whether the apnea is obstructive or central with enough certainty to classify them.

The AHI number is the Apnea/Hypopnea Index for the reporting period, which on the S9 LCD is typically the overnight number. For overnight (one day) data, the AHI is computed by the S9 as follows: It takes the number of all detectable events (obstructive apneas, central apneas, unknown apneas, and hypopneas detected) and divides that number by the time the machine was running. In other words, the AHI is the average number of apneas and hypopneas that occurred each hour the machine was on. The LCD display number on the S9 is simply truncated at one decimal place without any rounding as near as I can tell. I believe that for longer reporting periods (such as five days), ResScan simply averages the nightly AHI numbers to compute the one in the report. But I don't know for sure.

The AI number is the Apnea Index for the reporting period. It only counts the obstructive, central, and unknown apneas. In other words, the S9 computes this number by dividing the number of detected apneas (includes obstructive, central, and unknown apneas) by the time the machine was running. In other words, the AI is the average number of apneas that occurred each hour the machine was on. Again, the S9's LCD display number seems to simply be truncated at one decimal place instead of being rounded to one decimal place.

An example might help.  Suppose that on a given night the S9 detects 15 total events---let's say there are 9 obstructive apneas, 2 central apneas, and 4 hypopneas---and that the machine was run for a total of 6.6 hours.

The S9's LCD's overnight AHI, AI, and CAI numbers are computed as follows:
AHI = 15/6.6 = 2.272727 = 2.2 (due to truncating the decimal)
AI = 11/6.6 = 1.666667 = 1.6 (due to truncating the decimal)
CAI = 2/6.6 = 0.303030 = 0.3 (due to truncating the decimal)
    Note that we can use the LCD's overnight data to estimate the number of apneas, central apneas, obstructive apneas, and hypopneas by doing some quick multiplication of the LCD's overnight indices by the usage number. Here's a typical example:

    Let's suppose you look at the detailed Sleep Quality Data one morning and this is what you see:
    Usage: 7.3
    Pressure: 12.4
    Leak: 9.6
    AHI: 1.8
    AI: 1.4
    CAI: 0.3
    The Usage number indicates you used the machine 7.3 hours overnight.

    The Pressure number is the 95% pressure level. For example, if the LCD says the Pressure = 12.4, that means that your pressure was AT or BELOW 12.4 cmH2O for 95% of the night. It also means that your pressure was AT or ABOVE 12.4 cmH2O for 5% of the night.   Note: If you are using an S9 Elite or if you are using an S9 AutoSet in CPAP mode, the Pressure number will just be your Pressure setting and it will remain the same every day.

    The Leak number is the 95% excess leak rate in Liters per minute (L/min). Since the LCD says the Leak = 9.6, that means that your unintentional leak rate was AT or BELOW 9.6 L/min for 95% of the night. It also means that your unintentional leak rate was AT or ABOVE 9.6 L/min for 5% of the night.

    And how long is 5% of the night? Well, 5% of one hour = 3 minutes. So you can multiply the Usage time by 3 minutes to get an idea of how long your leaks were above the reported leak rate: In our example, leaks were ABOVE 9.6 L/min for a total of no more than 7.3 * 3 = 21.9 minutes and the Pressure was above 12.4 for a total of no more than 7.3 * 3 - 21.9 minutes.

    Since the usage was about 7.3 hours, we can also estimate the number of events you had and what type they were from the LCD's AHI, AI and CAI numbers as follows:

    Total number of apneas and hypopneas:
    AHI x Usage = (1.8 events per hour) x (7.3 hours) = approx. 13.14 events = 14 events (round UP since there's a fraction)

    Total number of apneas (all types):
    AI x Usage = (1.4 apneas per hour) x (7.3 hours) = approx. 10.22 apneas = 11 apneas (round UP since there's a fraction)

    Total number of central apneas:
    CAI x Usage = (0.3 CAs per hour) x (7.3 hours) = aprox. 2.19 central apneas = 3 central apneas (round UP since there's a fraction)

    Estimated Total number of obstructive apneas:
    First, an estimate of the OAI is simply OAI = AI - CAI. Note that if your S9 detects any Apneas of Unknown type, that will throw this calculation off, but it's still a good estimate. So here we go:
    OAI = AI - CAI = 1.4 - 0.3 = 1.1 and
    OAI x Usage = (1.1 OAs per hour) x (7.3 hours) = 8.03 obstructive apneas = 8 apneas (since we truncate to one decimal and because 8 + 3 = 11 apneas)

    Total number of hypopneas:
    First, an estimate of the HI is simply HI = AHI - AI. So here we go:
    HI = AHI - AI = 1.8 - 1.4 = 0.4
    HI x Usage = (0.4 Hypopneas per hour) x (7.3 hours) = 2.93 hypopneas = 3 hypopneas (Which make since because 11 apneas + 3 hypopneas = 14 events.)

    Of course, to get more detailed information about when the events happened and how long each of the apneas lasted, you will need to download the data into ResScan (or Sleepy Head) and look at the graphs for the night.

    Monday, March 19, 2012

    Average, Median, 95% numbers: A guide to those who don't remember their introductory stats

    Managing OSA with a full data CPAP/APAP machine involves a tremendous number of numbers. The indices (AHI, AI, CAI, OAI, HI, RERA I, etc) are best understood as the typical number of events of the given type that are expected to occur in one hour of sleep.. The computation of these numbers on a PSG is discussed in Understanding the data in your sleep test. The way our machines compute our overnight AHI (and other indices) is remarkably simple:
    • AHI = (number of events detected) / (total time the  machine was run)
    • AI = (number of apneas detected) / (total time the machine was run)
    • OAI = (number of obstructive apneas detected) / (total time the machine was run)
    • CAI = (number of clear airway apneas detected) / (total time the machine was run)
    • HI = (number of hypopneas detected) / (total time the machine was run)
    But the way leak data and pressure data is presented in ResScan, Encore Viewer or Pro, and SleepyHead involves a bit of elementary statistics.  Resmed users see median and 95th percentile for both the leak data and the pressure data in ResScan and 95% numbers on the S9's LCD. PR users see average leak rates and 90th percentile pressure levels in Encore. Users of SleepyHead can choose between median and weighted average for "middle" computations.

    And just what the heck to these numbers actually mean?

    What they mean, of course, is based on how they are computed. This blog entry computation focuses on how these various numbers are computed for a given set of data. The differences between median and (weighted) average are best understood by looking at what are called discrete sets of data. A discrete set of data is nothing more than a list of numbers. Once the data becomes continuous the ideas are the same, but the computations become more complicated. So to try to make this easier to understand, I'll stick with examples with discrete data. Let's look at a specific example. Suppose our data set looks like this:
     8.4, 8.4, 8.4, 8.4, 8.4, 8.4, 8.4, 8.4, 8.4, 8.4, 9, 9, 9, 9, 9, 9, 9, 9, 9, 9, 9, 9, 9, 9, 9, 9, 9, 9, 9, 9, 9, 9, 9, 9, 9, 9, 9, 9, 9, 9, 9, 9, 9, 9, 9, 9, 9, 9, 9, 9, 9, 9, 9, 9, 9, 9.5, 9.5, 9.5, 9.5, 9.5, 9.5, 9.5, 9.5, 9.5, 9.5, 9.5, 9.5, 9.5, 9.5, 9.5, 9.5, 9.5, 9.5, 9.5, 9.5, 9.5, 9.5, 9.5, 9.5, 9.5, 9.5, 9.5, 9.5, 9.5, 9.5, 10, 10, 10, 10, 10, 10.1, 10.1, 10.1, 10.1, 10.1, 10.1, 10.1, 10.1, 15.3, 15.3
     There are 100 numbers on this list.  The two 9's with the green background are the 50th and 51st numbers on the list.  The red 10, is the 90th number on the list.  And the blue 10.1 is the 95th number on the list..

    The median for this set of numbers is 9 because half of the data is AT or BELOW this number and half of the data is AT or ABOVE this number.  (Technically speaking the median of this set of data is the average of the two 9 with the green backgrounds.).

    The 90 percentile (90%)  for the data is 10  because 90% of the data is AT or BELOW 10 since the is the 10 is the 90th number on our list of 100 numbers..  And note that 10% of the data is AT or ABOVE 10 because the last ten numbers on the list are all at least as big as the 10  is.

    The 95 percentile (95%)  for the data is 10.1  because 95% of the data is AT or BELOW 10.1 because the 10.1  is the 95th number on our list of 100 numbers..  And note that 5% of the data is AT or ABOVE 10.1 because the last ten numbers on the list are all at least as big as the 10.1  is.

    The weighted average of the numbers is found by multiplying each number by the percentage of data points at that number. Since we've got 100 data points in our example, the percentage is just the number of times a given number appears in our list divided by 100.  If you count carefully, you find that the weighted average of this set of data is 9354, which is.found by this calculation:


    (0.1 * 8.4) + (0.45 * 9) + (0.3 * 9.5) + (0.05 * 10) + (0.08 * 10.1) + (0.02 * 15.3) = 9.354

    So for this set of data we get the following statistical numbers:
    • Median = 9
    • 90% = 10
    • 95% = 10.1
    • average = 9.354
    A lot of people will assume that the average and the median are in the same neighborhood.  But that really depends on the spread of the data.  In general, the average can be less than the median OR it can equal the median OR it can be greater than the median.  Indeed, in data sets with a very limited number of distinct numbers where one low number predominates, the average can even be greater than the 90% or even the 95% numbers.  For example, consider this set of data with 100 points:
    0, 0, 0, 0, 0, 0, 0, 0, 0, 0, 0, 0, 0, 0, 0, 0, 0, 0, 0, 0,  0, 0, 0, 0, 0, 0, 0, 0, 0, 0, 0, 0, 0, 0, 0, 0, 0, 0, 0, 0, 0, 0, 0, 0, 0, 0, 0, 0, 0, 0, 0, 0, 0, 0, 0, 0, 0, 0, 0, 0, 0, 0, 0, 0, 0, 0, 0, 0, 0, 0, 0, 0, 0, 0, 0, 0, 0, 0, 0, 0, 0, 0, 0, 0, 0, 0, 0, 0, 0, 0, 0, 1, 1, 1, 1, 1,  10, 10, 10

    The 50th and 51st data data points are the pair of green highlighted 0's.  So the median is 0.

    The 90th data point  is the red 0.  So the 90% number is also 0.
    The 95th data point is the blue 1.  So the 95% number is 1.


    But average is 3.4 because (0.91*0) + (0.4*1) + (0.3*10) = 3.4  and so the average is larger than even the 95% number.

    Now to tie this directly back to CPAP numbers:


    • The median leak rate is 25 L/min:  This means that for 50% of the night, your leak rate was AT or BELOW 25 L/min.   And for 50% of the night, your leak rate was AT or ABOVE 25 L/min. (Whether a leak rate of 25 L/min is good or not depends on whether your machine is reporting total leaks or  unintentional leaks.  The PR System One machines report total leaks and 25 L/min is going to be very, very good for most masks at pressures of up to about 8 or 9 cm.  The Resmed machines report unintentional leaks and 25 L/min is above the Red Line of 24 L/min, which means the leak rate is bad.
    • The 90% leak rate is 35 L/min.  This means that for 90% of the night, your leak rate was AT or BELOW 35 L/min and for 10% of the night your leak rate was AT or ABOVE 35 L/min.
    • The 95% leak rate is 40 L/min. This means that for 95% of the night, your leak rate was AT or BELOW 40 L/min and for 5% of the night your leak rate was AT or ABOVE 40 L/min.
    • The average leak rate is 28.89 L/min.  Remember this tells you nothing about how much time you spent with a leak rate that was AT or BELOW 26.89 L/min because there is no concrete relationship between the average of a set of numbers and percentiles for the data.
    Pressure numbers are similar for APAPs in Auto mode:
    • The median pressure is 9.5 cm H2O:  This means that for 50% of the night, your pressure was AT or BELOW 9 cm H2O..   And for 50% of the night, your pressure was AT or ABOVE 9.5 cm H2O
    • The 90% pressure is 11 cm H2O.  This means that for 90% of the night, your pressure was AT or BELOW 11 cm H2O and for 10% of the night your pressure was AT or ABOVE 11 cm H2O.
    • The 95% leak rate is 11.5 cm H2O. This means that for 95% of the night, your pressure was AT or BELOW 11.5 cm H2O and for 5% of the night your pressure was AT or ABOVE 11.5 cm H2O..
    • The average pressure is 9.65 cm H2O.  Remember this tells you nothing about how much time you spent with a pressure that was AT or BELOW 9.65 cm H2O because there is no concrete relationship between the average of a set of numbers and percentiles for the data.

    Wednesday, November 16, 2011

    Musing on "I have heard terrible things about CPAP" ...

    On one of the boards I frequent, yet another newly diagnosed OSA sufferer wrote
    I have heard terrible things about these [CPAP] machines.
    It's not uncommon for newly diagnosed folks to write something like this. I believe these kinds of statements express the newbies' concern about the "horrors" that they has heard of concerning CPAP therapy and I also believe these statements touch upon an unspoken fear that the author is deeply worried that he/she will not be able to adjust to CPAP. And I think that worry is a pretty common concern among folks when they are first diagnosed.

    After all, it is true that CPAP has a very bad reputation out there. That reputation is based on a number of things, including a certain, shall we say, psychological knee jerk response to being told we have to sleep with a six foot hose on our nose every single night, all night long for the rest of our lives: I have to sleep with THAT thing on my face for the rest of my life? HOW the heck am I supposed to do that?

    And the fact is: Many of us do have to work (and work hard) at learning how to sleep with a hose on our nose at night. But in the grand scheme of things, at least the machine is just blowing slightly compressed room air down our airways while we are asleep, and hence (largely) unconscious. It's not like we are confined to a wheel chair for the rest of our lives. It's not like we are being tethered to an oxygen tank for 24 hours a day. It's not like we have to to prick our fingers multiple times a day to draw a blood sample and then inject ourselves with insulin. And it's not even like we are being told we need to take daily medicine that is known to have serious common side effects.

    But it is also true that many new CPAPers give up in frustration as soon as they hit the first set of problems: Problems that seem insurmountable, but are not. Problems that no matter how bizarre they seem to the new CPAPer have undoubtedly been faced and solved by many a successful CPAPer. The folks who work in sleep medicine are concerned about the large numbers of new CPAPers who just give up. And studies have shown that quality patient education about OSA, its potential serious consequences , how the CPAP therapy works and quality patient support in helping to resolve common comfort problems at the start of learning how to sleep with a CPAP both dramatically increase a patient's chances for making CPAP work for him/herself in the long term.

    Unfortunately, quality patient education and support can be hard to come by. The lucky newbies find a forum like cpaptalk.com or apneasupport.org. And once a newbie finds a forum, it can provide the education and support the newbie needs in his/her effort to make CPAP work in his/her bedroom every single night.

    But the one thing we at the forums cannot provide is will power and commitment to doing the necessary work. So if you are newly diagnosed with OSA remember this: It really is up to you. You can decide their life and health is worth the effort and make a serious commitment to doing everything you can to adjust to therapy for a period of several months to a year before declaring the experiment a failure. Or you can decide to give up and continue living with the growing negative influence of OSA and its effects and consequences in your daily life.

    And please understand: I say these things as someone who has had a long and difficult adjustment period to CPAP. But in the end, I'm very glad I was stubborn enough to not give up. The first three to four months of my PAP therapy were hellish. But by the end of month five, I was starting to notice a few subtle small and totally unexpected positive changes in how I felt when I woke up each morning. In particular, I was starting to wake up on some days pain-free: As in no headache and no pain in my hands and feet. Pain that I'd been waking up with for a number of years. And in my sleep log, phrases like, I woke up almost refreshed and somewhat rested started to appear. By the end of month six, I was waking up pain free as often as 5 or 6 days out of every week. And occasionally I was noticing I was genuinely refreshed when I woke up in the morning. And now? I'm 14 months into therapy and on my best days, I wake up feeling like I felt back in my 30s---some 20 years ago. My biggest complaint about CPAP these days is that I am greedy: I want all my days to be like those best days. But even on my more typical days? I am finally feeling quite a bit better than I did before CPAP on most days. On most days, I wake up feeling like I have gotten some high quality sleep: I wake up feeling rested and usually refreshed.

    And as for the still overwhelming notion that I will have to sleep with the hose the rest of my life? I deal with that one night at a time. Each night when it is time to mask up, I only focus on tonight. I tell myself: Tonight I'll put the hose on so that I'll feel decent tomorrow morning. I don't allow myself to think about or worry about all those nights in the future. And slowly, but surely, putting the hose on my nose is becoming a habit---one small part of my bedtime ritual rather like brushing my teeth is.

    Wednesday, October 26, 2011

    Who do Resmed and PR think the customers are?

    Something posted over at cpaptalk.com today got me thinking about this issue yet again. It's commonly assumed over there that CPAP manufacturers think of the DMEs as their customers instead of us. And given how the manufacturers keep making dataless bricks that record nothing but compliance data and the facts that Resmed quit selling ResScan to patients several years ago and that PR still has not yet updated EncoreViewer to a version that cleanly installs and is supported on 64-bit PCs, it's easy to see why so many of us hoseheads come to believe that the manufacturers care more about pleasing the DMEs (and their bottom lines) instead of us, the hoseheads, and our comfort at night and the quality of our therapy.

    And I've come to the conclusion that the CPAP manufacturers could learn a lot from the Scooter-chair makers, the diabetes supplies makers, blood pressure monitor makers, and many drug companies, all of whom market their equipment/drugs directly to the patient.

    Imagine what would happen if the PAP manufacturers would figure out a way of running a really clever multi-media advertising campaign aimed at the large mass of folks walking around with undiagnosed OSA and manage at the same time to reduce the substantial negative stigma that is attached to both OSA and the very idea of sleeping with a PAP machine: The number of folks being willing to get tested would go up, the number of people accepting the challenge of making this therapy work would go up, and ultimately, the likelyhood of folks actually using the machines as intended would go up, and the companies' profits would go up.

    And just what would that advertising campaign need to make use of? People in control of their OSA instead of OSA destroying their lives. And that would, naturally, include people knowing and understanding the efficacy data among many other things:

    Hi, I'm RobySue and I have OSA. WIthout CPAP my AHI was 23.4 and I woke up tired and in pain and listless most days. But with the help of this marvelous S9*, my AHI stays between 1.0 and 2.0. And I've got so much more energy these days---energy to do the things that I simply wasn't able to do before, like climbing this wonderful mountain here in the background or dancing in the disco with my hubby or enthusiastically playing with my puppies in the park .....

    And the voice over then saying something to the effect of,

    If you wake up feeling unrefreshed most mornings, have morning headaches, excessive daytime sleepiness and fatigue, or snore, you may have OSA, ask your doctor about OSA. And if you are diagnosed with OSA, be sure to ask for a Resmed S9 machine to treat your OSA. Our machines are quiet and easy to use with features that matter most to OSA sufferers as heated humidification; the ClimateLine hose---a heated hose that provides state of the art protection from condensation; our pattened EPR system to make exhaling easy and breathing with the machine natural; full leak data so you can proactively deal with any leak issues; full efficacy data so you know your OSA is under control night after night; and a user friendly software system for fully monitoring your condition. So you can get on with the business of living your life to the fullest.


    * NOTE: I tried to write this for the PR System One that I now use since I really do find the PR System One BiPAP much more comfortable to sleep with night after night than I did the S9 AutoSet. But "full leak data" just ain't there, even with Encore Viewer: I've been using the S1 BiPAP for close to 10 months now. And I still have only the foggiest notion of what actually triggers a "Large Leak" because in my particular situation, a "Large Leak" is all but impossible to trigger no matter how badly I'm leaking.

    When the DME was testing my machine to see if there was something wrong with it, they were able to "duplicate" a Large Leak that topped out at just over 80 L/min.

    In actual use? In 10 months of use, I have had one large leak flagged in use: Back in June, I did have a total leak that hit 60 L/min for 2 minutes that got flagged as a Large Leak. At my range of pressure settings, my intentional leak is 20--29 L/min; so that 60 L/min figure represents an unintentional leak of somewhere between 30 and 40 L/min. Moreover, this two minute horrendous leak was in the middle of a very bad 50 minute period where the total leak rate steadily and rapidly increased from about 20 L/min (baseline) to about 50 L/min in a ten minute period, then bounced up to 60 L/min for two minutes, and then settled back in at the very elevated (for me) level of 35-45 L/min for 40 more minutes before I woke up, turned the machine off, fixed the leak and turned the machine back on. During that whole 50 minute period, there's at least 10-15 minutes where the total leak rate is at or above 45 L/min, which is 25 L/min above my normal baseline of about 20 L/min. If a similar leak had happened when I was using the S9, it looks to me like about 20--25 minutes of that nasty leak would have been over the infamous RedLine at 24 L/min for unintentional leaks, with a sizable chunk of the rest of it just below the RedLine. Not enough to trigger a visit from Mr. Red Frowny Face; but evidence in ResScan that the leak was long and significant.