For this exercise, I've chosen the night of July 1, 2012. Note that bedtime was 2:52 AM on July 2. This was the night when I broke my left pinky when I was out on my nightly walk/jog, so pain was an issue: At the ER, all the doc did was pull the broken and dislocated finger straight, buddy taped it to the ring finger, took x-rays, and informed me that I needed to see a hand specialist the next day because the finger likely needed to be pinned. Because of the pain, I took a sonata that night. Undoubtedly those things adversely affected my sleep that night because this was a night where my snoring was much worse than it normally is and the AHI is a bit higher than it typically is.
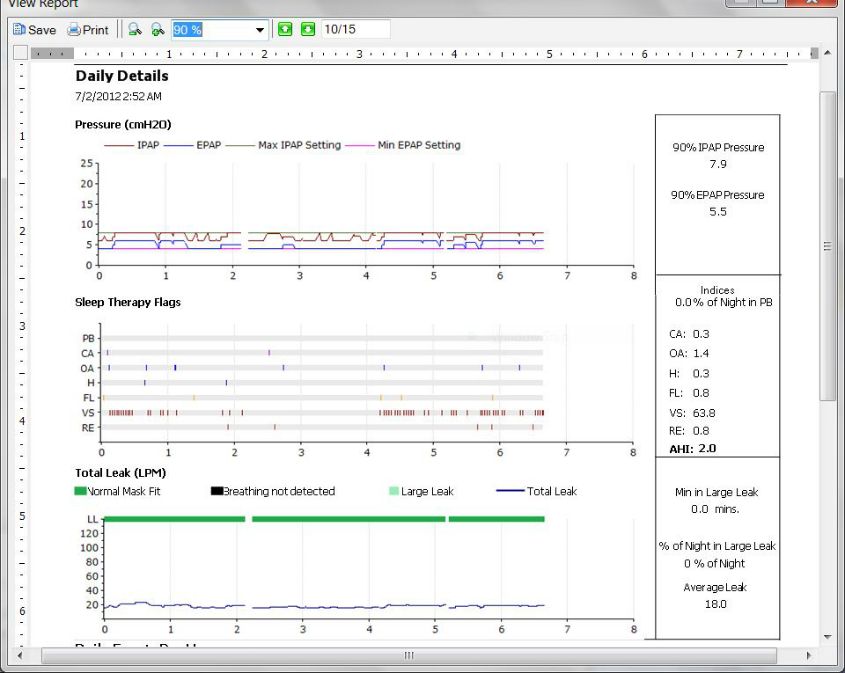
Here's the night's data in Encore:

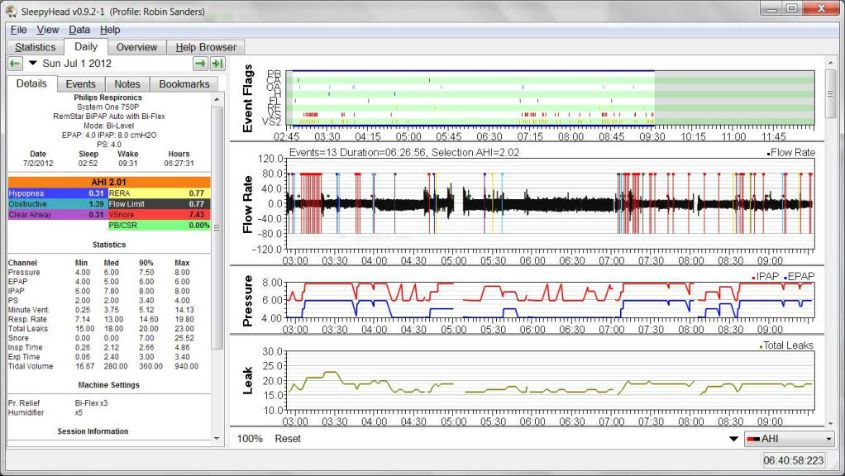
And here's the same night in SH:

AHI and the other indices
If you look at the index numbers, you'll see that the only difference between the AHI, OAI, CAI, HI, FLI, and REI numbers are that SH rounds to two decimals and Encore rounds to one decimal. If you round the SH numbers to one decimal, you get the Encore numbers.But clearly that's not the case for the VSI numbers. Encore reports a VSI = 63.8 and SH's VSnore Index = 7.43. Of course, the SH VSnore index only includes VS1s. But even if we take the VS2s into account, it's still impossible to immediately reconcile the Encore VSI with SH data. Clicking on the events tab for this night reveals that SH says there were 48 VS1s and 57 VS2s recorded during the night. That's a total of 105 snores altogether. And if we compute a snore index in the usual way, we'd expect:
snore index = (105 snores)/(6.45833333 hours) = 16.258Interestingly, our computed snore index is about 1/4 the size of Encore's VSI. But it's not clear at all how Encore is computing the VSI. Digging deeper into the snore data, I can show that on this particular night:
(Sum of the VS2 parentheses numbers)/(usage time) = Encore VSII have no idea if this is the real definition of the Encore VSI or just an interesting coincidence. And I don't want to get too side tracked by the snore data---that's another post I intend to write later.
Leak data
Notice that Encore reports the average total leak, but I've chosen "median" for the middle computations in SH. However, SH computes the "averages" for each of the items listed in the left sidebar even if you've set the default to "median". To see these "averages", all I have to do is hover my mouse over the name and the "average" will appear in a pop-up box.On this night, the median leak rate just happens to be pretty close to the average leak rate. (That's a mathematical coincidence.) Sleepy Head computes the average leak rate as 18.03 L/min, which rounds to Encore's 18.0 L/min average leak rate. I find that usually the SH average leak rate and the Encore average leak rates are typically pretty close.
The leak line in Encore looks much flatter than the one shown in SH. That's because of the scale of the vertical axis in each graph: My leak data on this night is trapped in an 8 L/min range (from a low of 15 L/min to a high of 23 L/min). On the SH graph, the total range for the graph is from 10 L/min to 30 L/min. So the leak data fill up just over a third of the available space in the vertical direction. But the vertical range for the Encore graph is from 0 L/min to 140 L/min, and my data takes up only 1/16 of that range. Hence the bumps look much smaller in Encore than they do in SH. And for newbies: This night's leak line is a really nice leak line.
Pressure data
The 90% pressure data is problematic: Ever since I switched to SH 0.8.8, I've noticed that SH almost always gives me integer values for the 90% pressure data, but it reports it to two decimals. In other words, rounding the SH 90% pressure data to one decimal doesn't change it. The difference between Encore's 90% IPAP = 7.9 and SH's 90% IPAP = 8.00 doesn't seem big enough to worry about.But Encore's 90% EPAP = 5.5 and SH's 90% EPAP = 6.0 differ by 0.5 cm and my max EPAP = 6cm, so that's a pretty large discrepancy. And for the 90% EPAP, large discrepancies between Encore and SH seem to be common in my data. So which software should I believe for the 90%b EPAP number?
It's worth pointing out that JediMark, the author of Sleepy Head, knows that there are some problems with how he is computing 90% and 95% numbers. But it's also useful to point out that Encore's 90% numbers do not always make sense eirther.
For this night's data I can get a rough idea of which is more likely the correct number by doing a bit of basic arithmetic: I used the machine for 6:27:31, which is close enough to 6:30 for approximations. And 10% of one hour is 6 minutes. So 10% of 6.5 hours is 6*6.5 = 39 minutes. So the question becomes: Can we find about 40 minutes or so of time with the EPAP pressure at around 6 cm? If so, then the 90% EPAP = 6. And in eyeballing the pressure curve, it's clear the EPAP = 6 for at least 30 minutes between 3:00 and 4:30 and it's also clear that the EPAP = 6 for at least 30 minutes between 7:00 and 8:00. Hence, it's clear that EPAP = 6 for at least an hour, which indicates that the 90% EPAP really should be reported as 6cm instead of 5.5cm.
No comments:
Post a Comment